GEBRA™ HPO Visualizer
The newly introduced HPO Visualizer transforms complex symptom data into intuitive visual information, dramatically improving readability and interpretation efficiency during phenotype-driven analysis.
💡 What’s New?
- Organ/System-Based Visualization: Instead of scrolling through text lists, you can now view symptoms on a ‘Human Body Map’ to immediately identify which organ systems are most affected.
- Interactive Filtering System: Filter symptoms by specific organ systems with a single click, or use the hover feature to highlight matching symptoms in real-time.
- Visual Overlap Identification: Areas where disease and patient symptoms overlap at the system level are color-coded, making comparative analysis significantly faster.
🧭 Where to Find It?
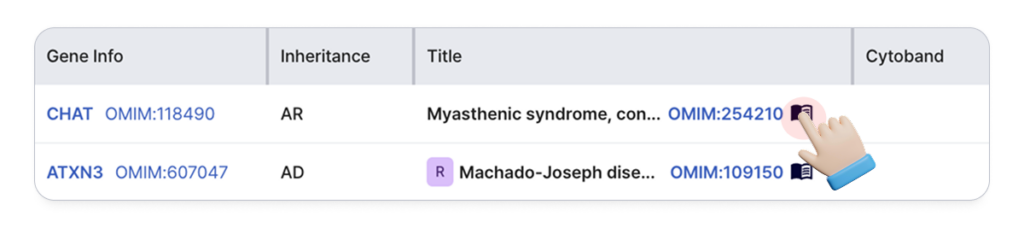
In the variant list, click the 📘 View disease details icon next to any disease name. Along with the existing disease information, you will find the new Visualizer panel displaying the symptom distribution between the patient and the selected disease.
1. Visual Distribution & Smart Filtering
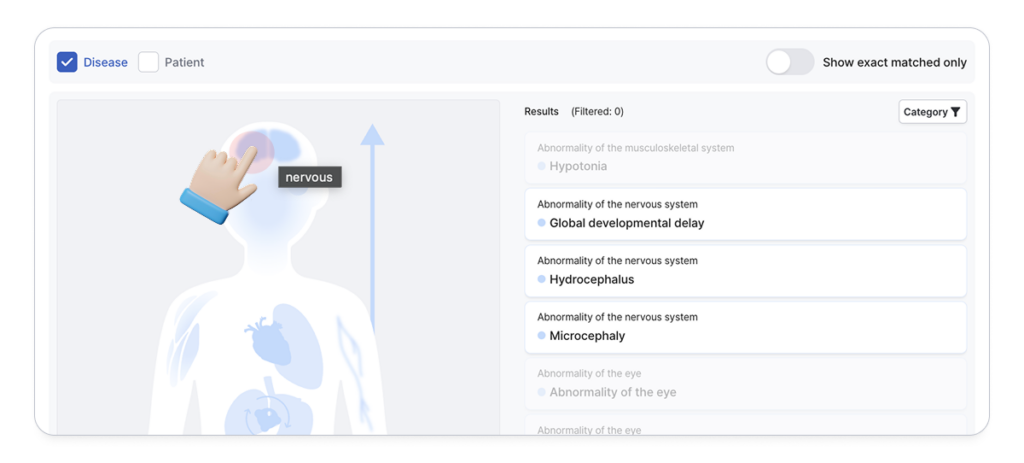
- Human Body-Based Visualization: Clicking a specific organ or system in the body guide (left panel) filters the symptom list (right panel) to show only relevant terms.
- Real-Time Highlighting: Hovering over an organ immediately highlights the associated symptom names in the list, allowing you to simultaneously check location and detailed information.
2. Disease vs. Patient Comparison Options
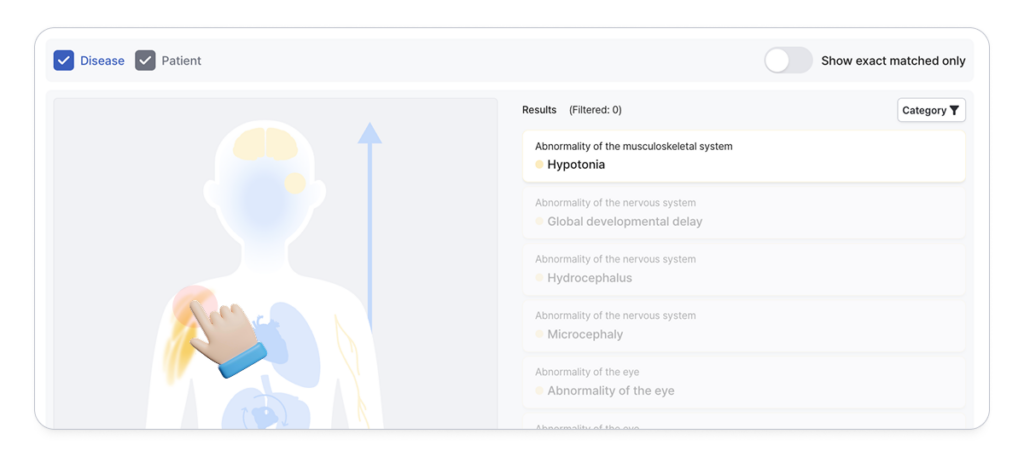
Use the checkboxes at the top of the Visualizer to customize your view:
- Disease 🔵: Displays the distribution of symptoms characteristic of the disease.
- Patient ⚪️: Displays the symptoms reported for the patient.
- Disease + Patient 🟡: Highlights systems where both disease and patient symptoms overlap, allowing for immediate correlation.
3. [Exact Match] Quick Identification of Matching Phenotypes
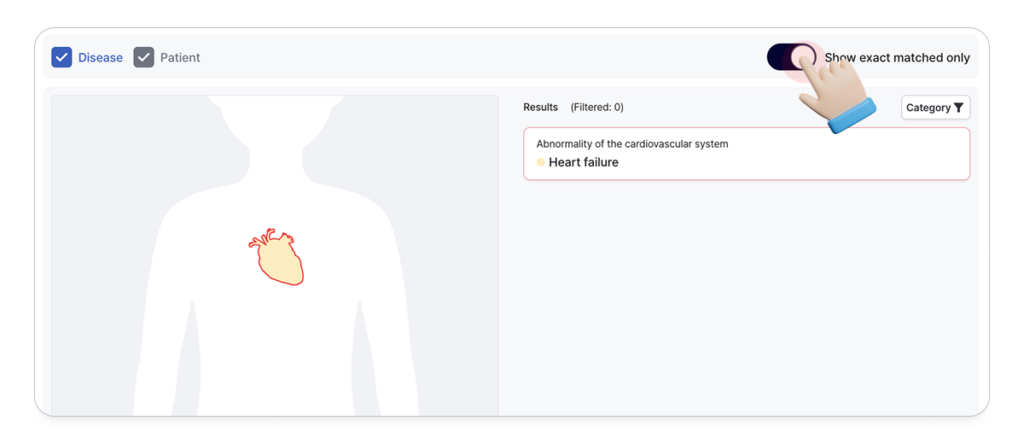
- Show exact matched only: Enabling this option filters the list to show only symptoms where the disease and patient terms match exactly.
- Red Border Highlight: Exact matches are emphasized with a red border, helping you distinguish precise phenotype concordance from general system-level similarity.
The HPO Visualizer is a key update in GEBRA’s ‘New Feature’ series. We are committed to redefining the analytical experience by reducing cognitive load and supporting confident clinical decision-making.
Moving forward, GEBRA™ will continue to introduce:
- Innovative features that provide new analytical perspectives.
- Meaningful enhancements driven by user feedback.
Look for these updates through our New Feature popups and this official blog series.
Take a look at all GEBRA™ Related Articles:
- GEBRA™ Use Guide: 3ASC – Finding the One Causal Variant Among Thousands
- GEBRA™ Use Guide: Symptom-driven Update — When Phenotypes Evolve, Your Shortlist Should Too
- GEBRA™ Use Guide: Filters – See What Matters, Faster
- GEBRA™ Use Guide: Knowledge Base – Interpretations That Persist, Diagnoses That Compound
- GEBRA™ Use Guide: Gene Coverage – Diagnostic Confidence Starts with Coverage
- GEBRA™ Use Guide: 3bCNV – From Copy Number Variant Detection to Clinical Interpretation
- GEBRA™ Use Guide: Symptom Color Tag
Get exclusive rare disease updates
from 3billion.

3billion Inc.
3billion is dedicated to creating a world where patients with rare diseases are not neglected in diagnosis and treatment.