Why do WES test results vary despite the same sequencing method?
Recently, WES/WGS tests have become more widely used to diagnose patients with rare diseases. Even if the same WES method is performed on the same patient, the final result may be different depending on the entity. Why is there a difference? What should be considered when choosing? We will look at the main factors that contribute to the difference.
First of all, the process of WES testing consists of 5 stages as shown in Figure 1.
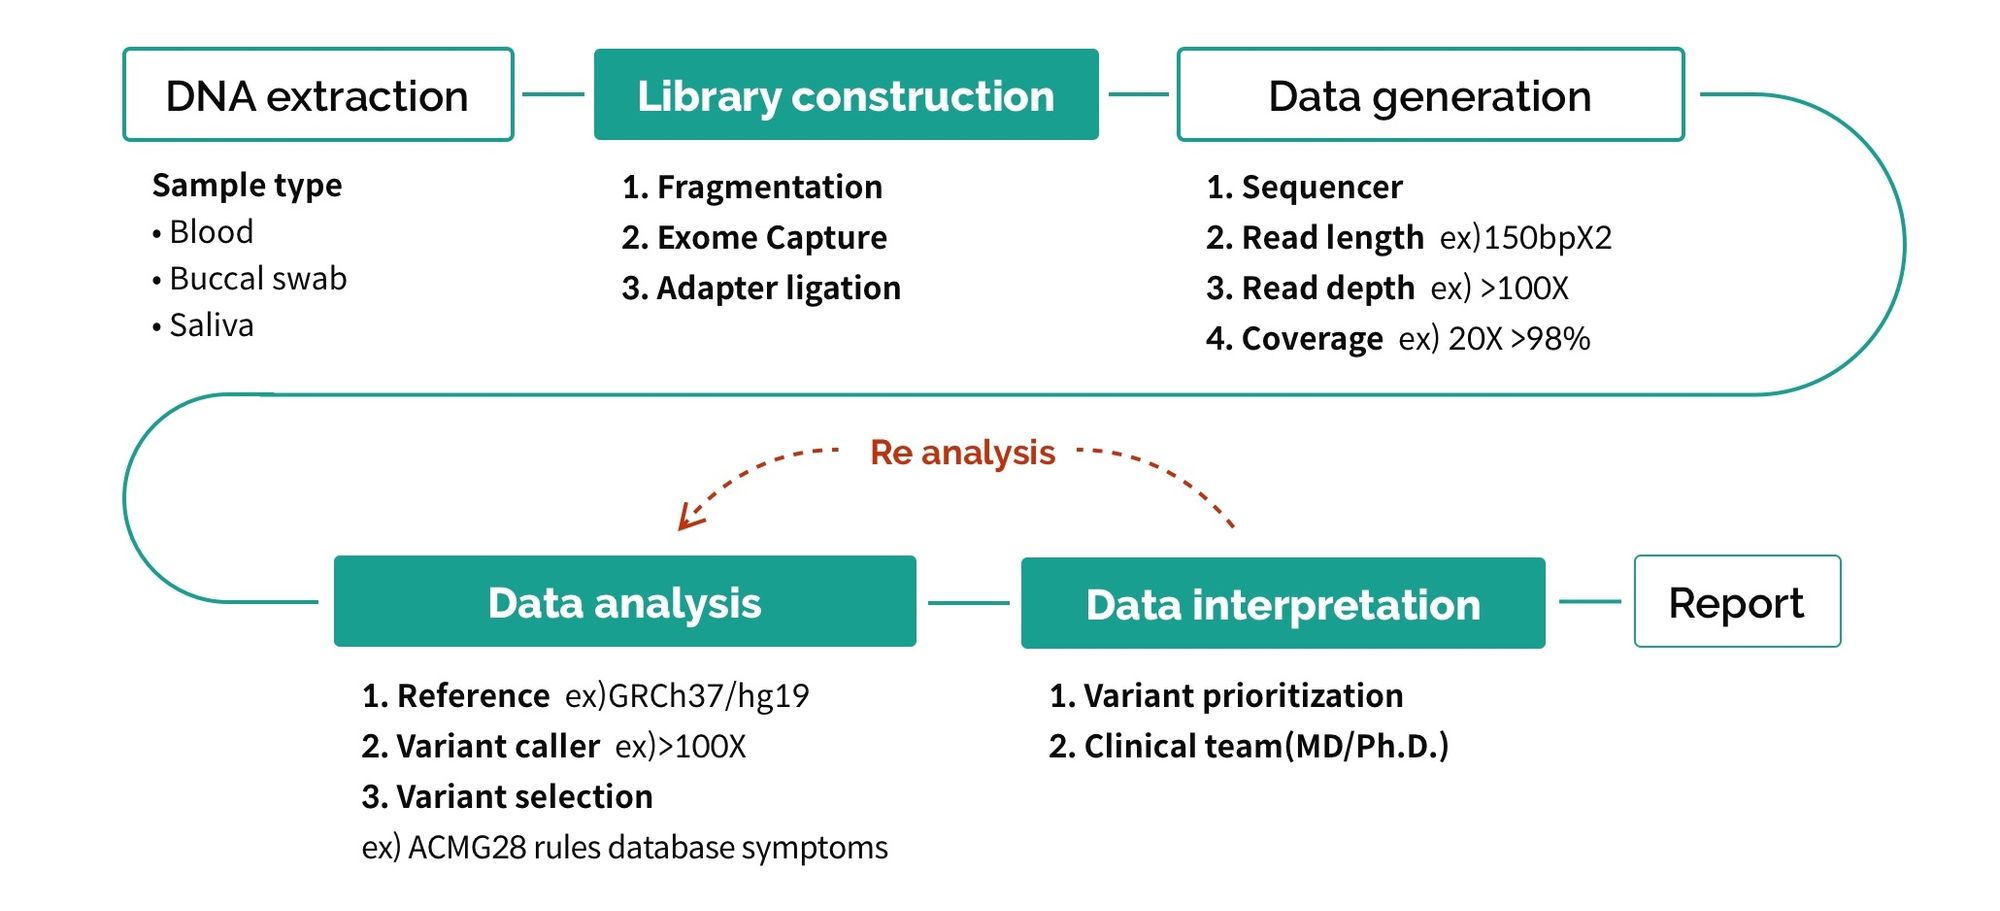
There are various factors that cause differences in each stage, but we will take a closer look at the three biggest factors (marked in green).
– Library construction: Data quality according to different exome capture kit performance
This is the process of selecting only the exome region out of the entire genome. Depending on the type of kit, the probe manufacturing method and target regions are different, thus leading to a difference in efficiency.
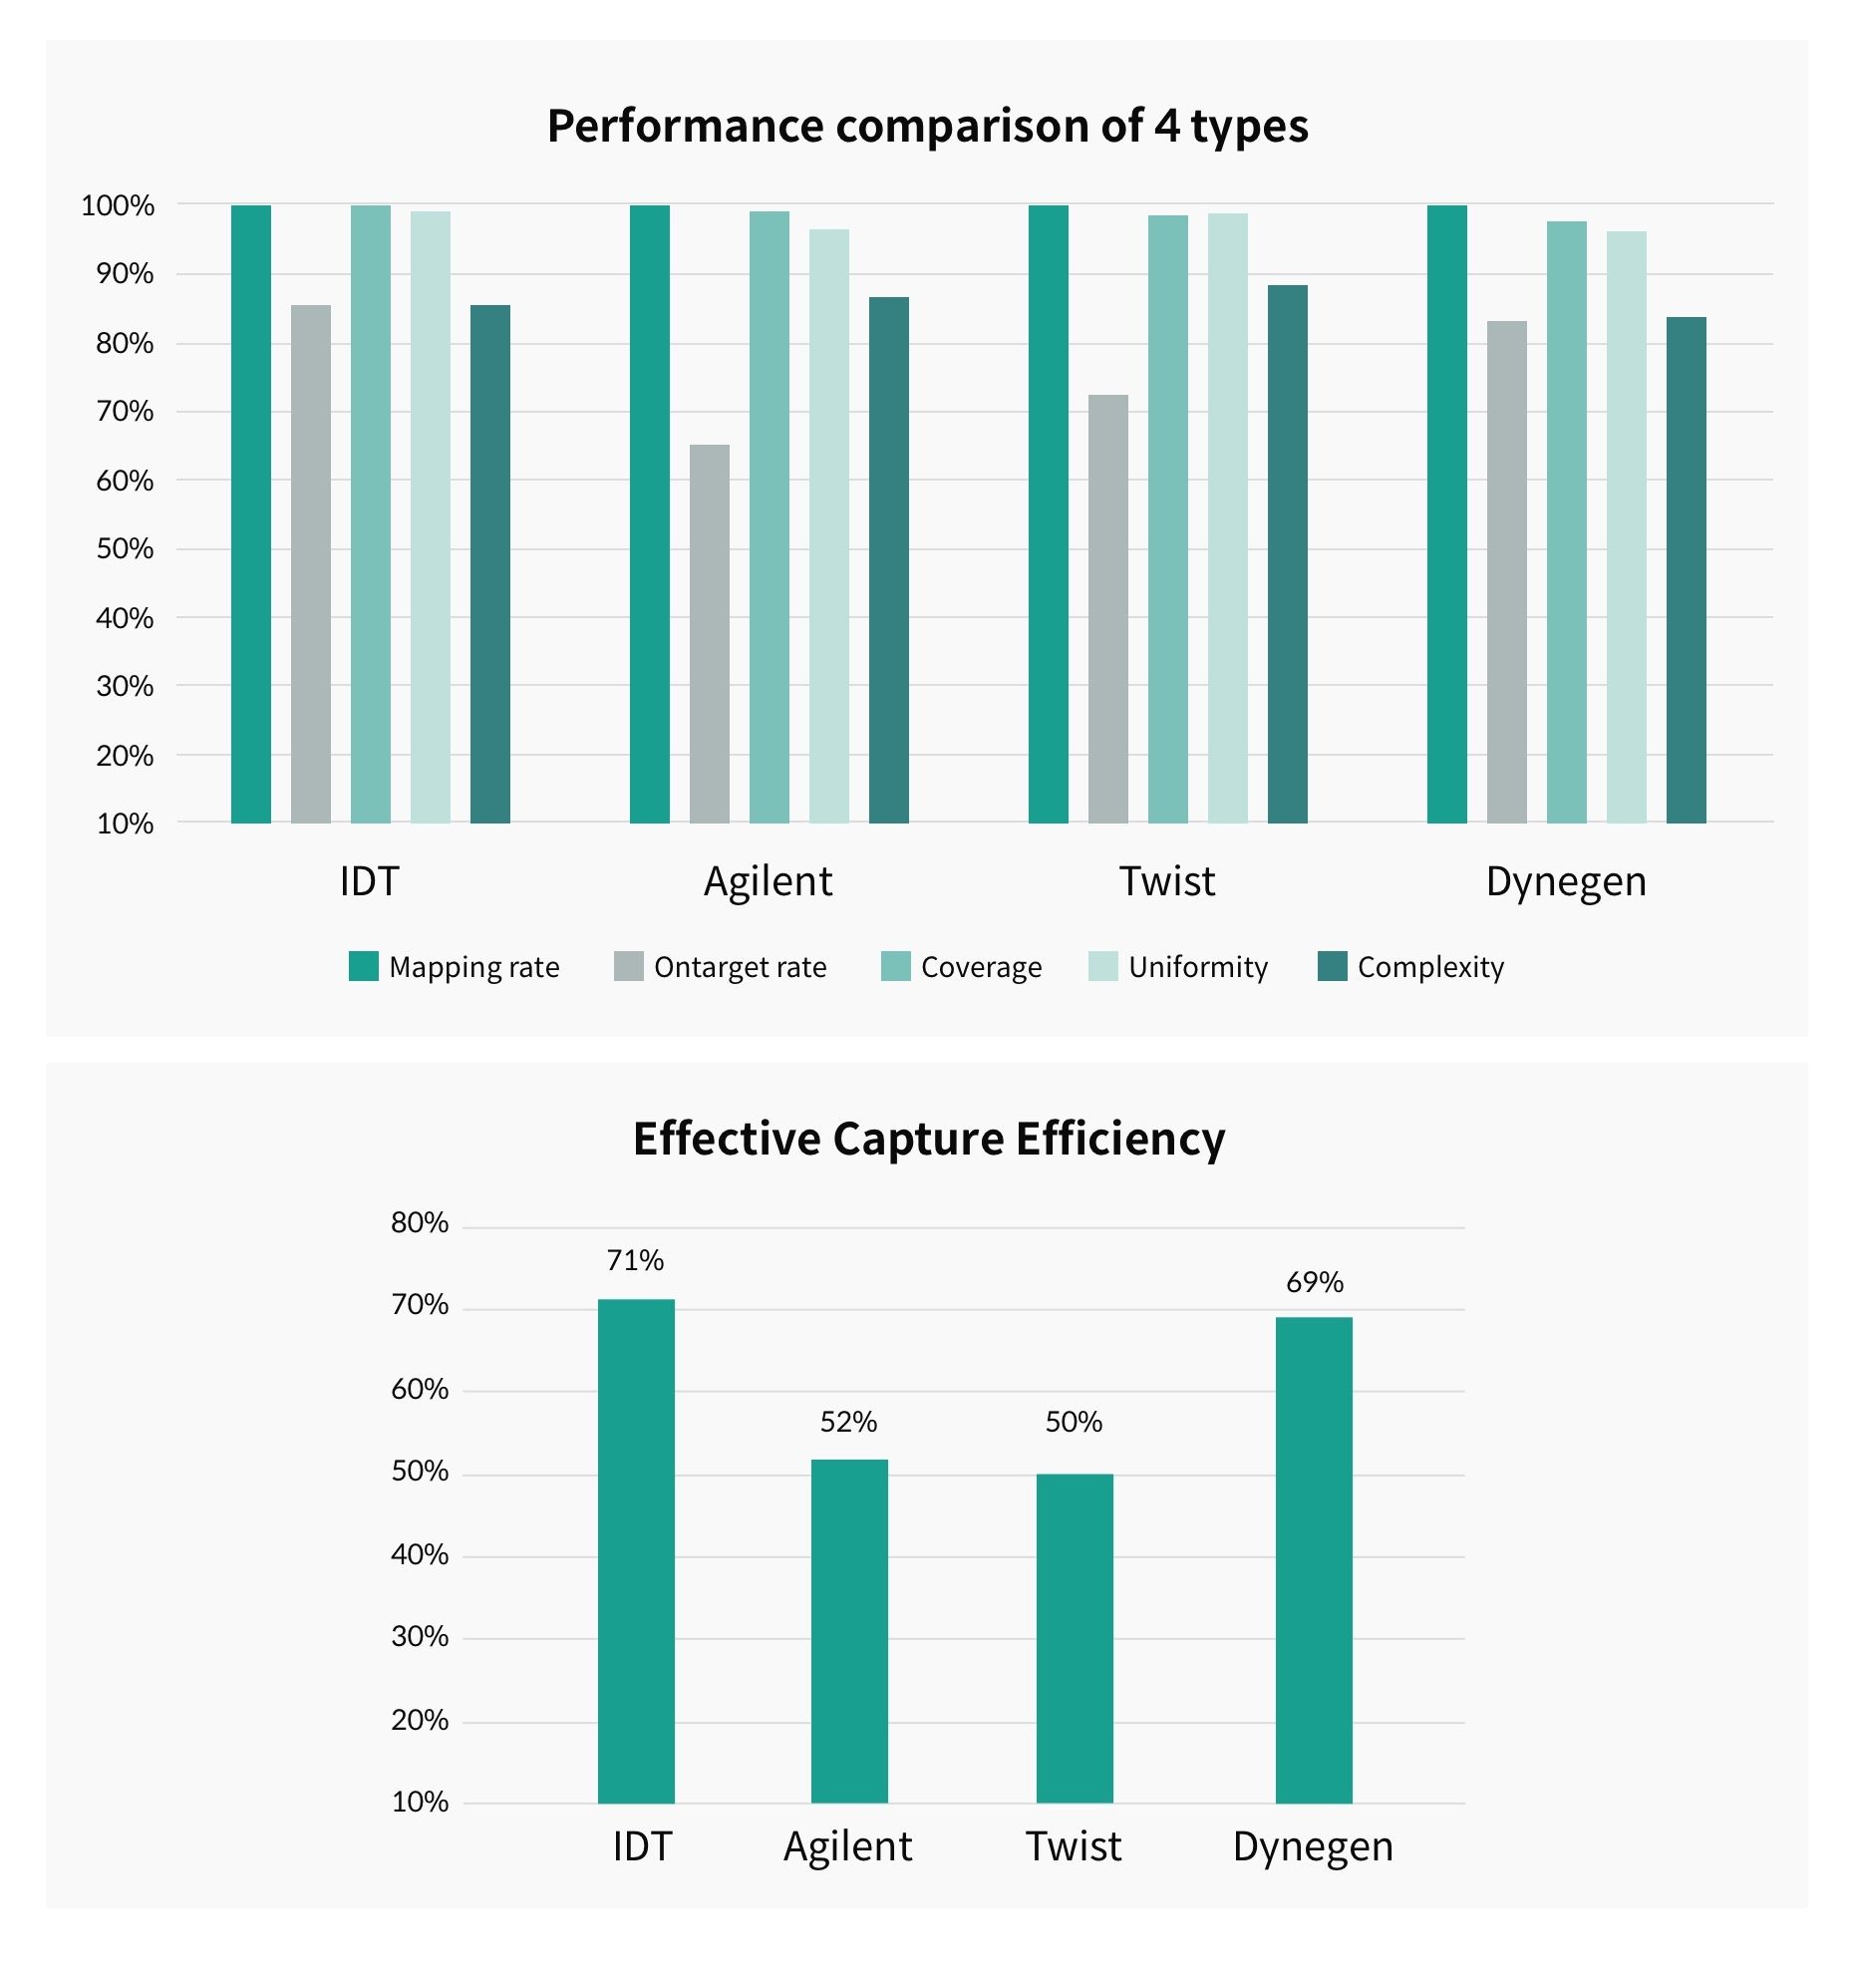
Figure 2 shows the results of a study1 comparing capture efficiency according to 5 criteria for each kit type. Upon comparing a total of 4 types of kits, IDT and Dynegen kits showed the highest efficiency. According to the study results, the IDT kit has the advantage of evenly covering the entire exome region with its high coverage in the GC-rich region where PCR bias frequently occurs.
– Data analysis: Different method of ACMG guideline application in variant selection
The raw data that has passed QC standards is aligned with the reference to detect variants. On average, about 80,000~100,000 variants are generated from a person’s WES data, and the key to diagnosis is to prioritize and select the variant most closely related to the patient’s symptoms.
Most variants are classified into 5 categories based on the 28 criteria in the ACMG guidelines (3billion white paper, p. 9-13), but since the guidelines are not “clear rules,” differences may occur from the following factors:
- Number of rules appliedThere are 28 rules, but the result depends on how many rules are applied and how the result is interpreted by each entity during analysis.
- Interpretation methodEach rule is not a “clear” rule but a recommended guideline, so even if the same rule is applied, there may be a difference in result. In particular, PS4, PS3, PM1, etc. require a lot of manual confirmation, so it is a rule with high discordance among entities.
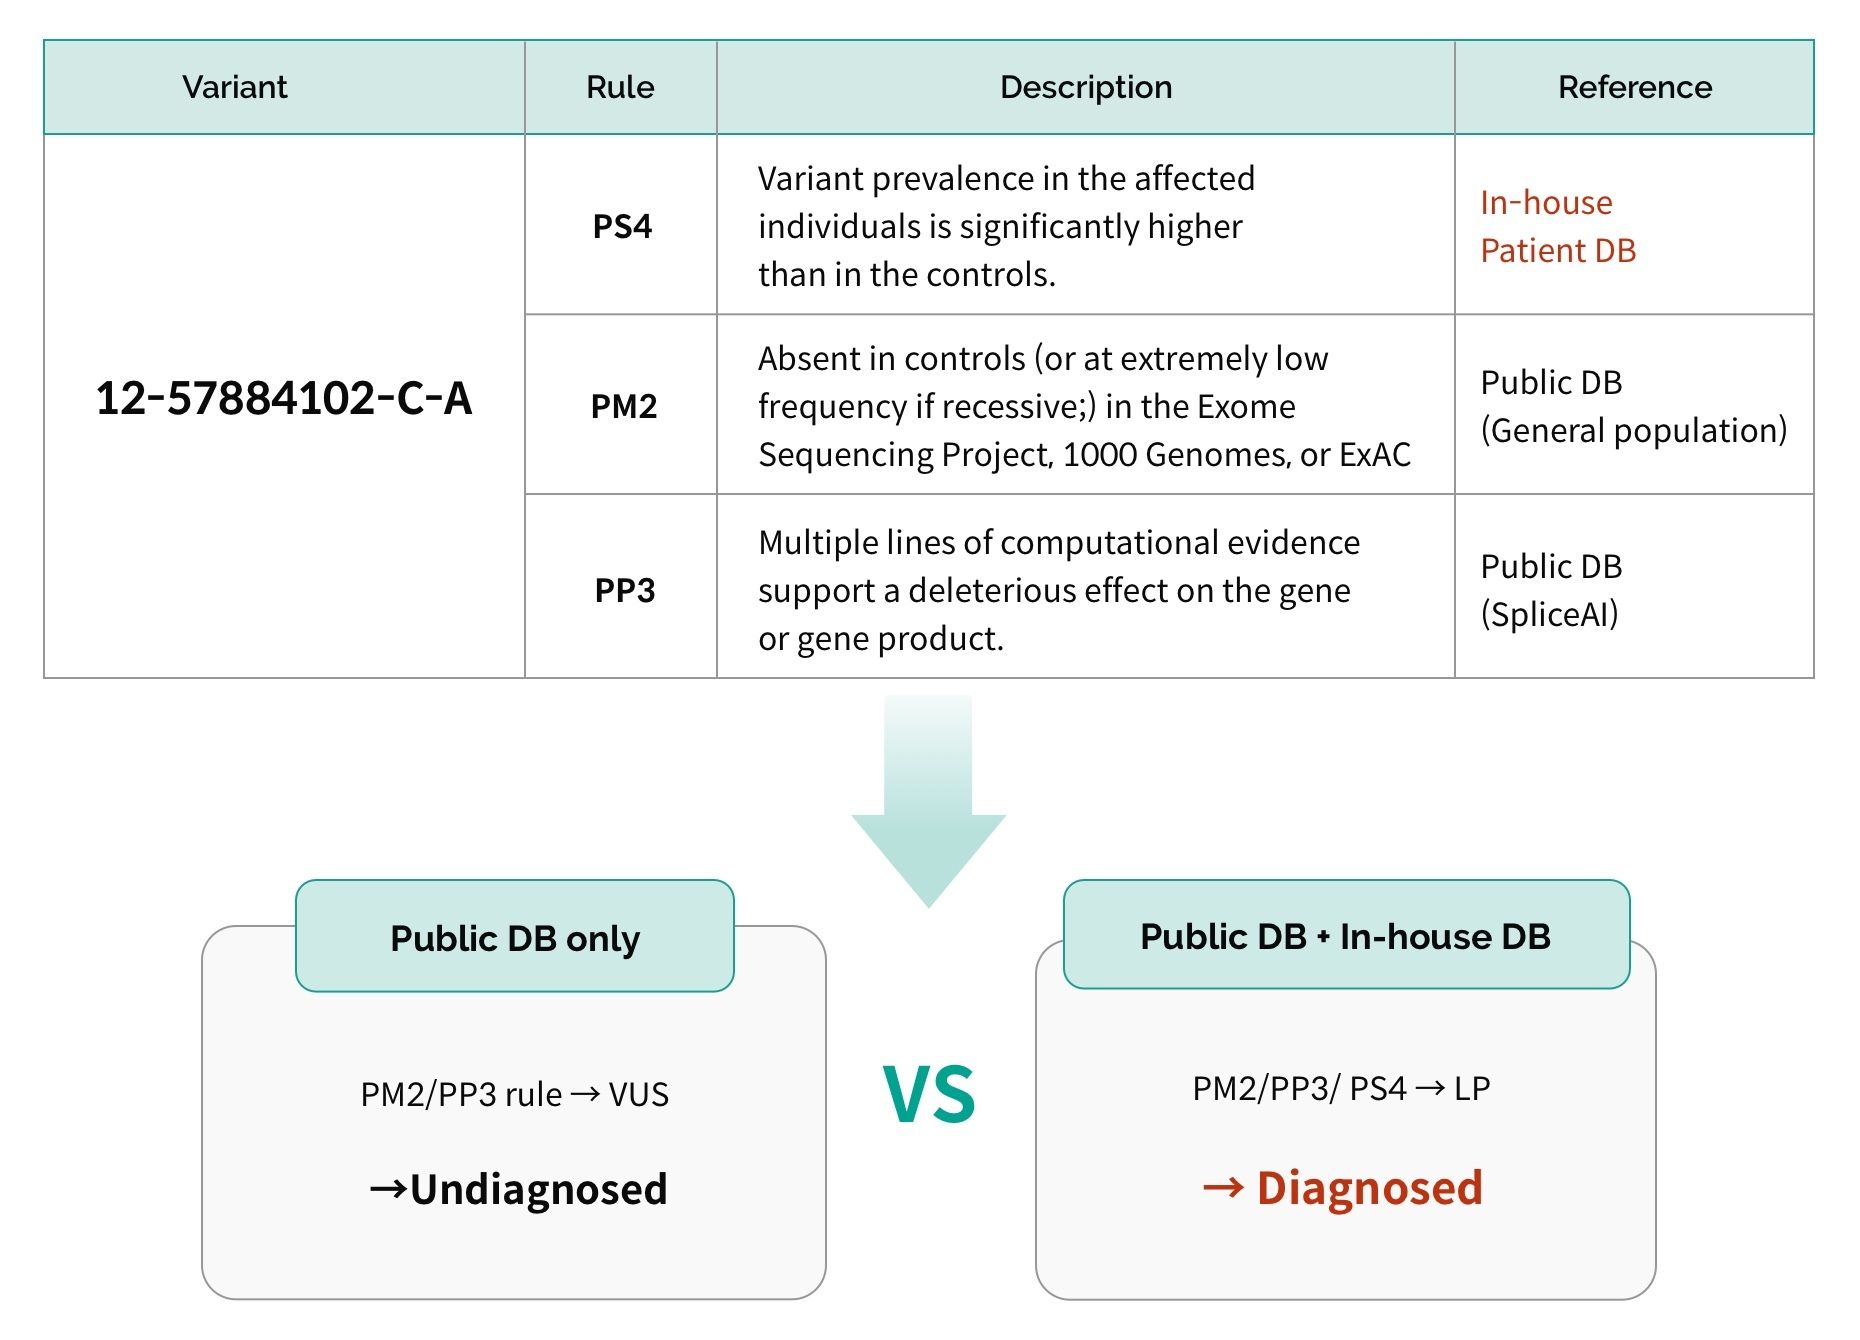
- Difference in databases useWhen rare disease-related variants are found by researchers, they are registered in public databases such as ClinVar and HGMD, which are widely utilized. The more frequently the database is updated, the more recent information it has. Also, aside from publicly available databases, if an entity has its own inhouse database, depending on the database size and content, there may be variants that can only be interpreted by specific entities.
– Data interpretation: Difference in diagnostic accuracy according to interpreter expertise
A patient cannot be diagnosed based on genetic information alone. Even if there is a strong pathogenic variant, if it does not match the patient’s symptoms, it is difficult to determine the causative variant. Results may vary depending on how much the entity incorporates the patient’s symptom information during analysis. The participation of clinical doctors and geneticists in the interpretation process is an important factor when there is a suspected variant to obtain additional information through direct discussion with the ordering physician and to accurately understand and incorporate symptom information.
Although there are over 7,000 rare diseases, there are still many diseases of which their cause is unknown. Recently, as research on rare diseases has become more active, more than 300 new variants are being discovered every year2, emphasizing the importance of reanalysis. Through WES, initially generated data can be reanalyzed, which can lead to a new diagnosis within a year for 10-15% of patients.3,4
Results may vary by entity due to the described variables. In order to close this gap, it is necessary to move away from exclusive ownership of information and enable more collaboration through the sharing of information through public databases. This could be a shortcut to ending the diagnostic odyssey of rare disease patients and the reason for what we do.

Curious How We Boost Diagnostic Accuracy?
Get the newsletter every month and discover the breakthroughs with the latest reanalysis report.
- J Zhou et. al., Performance comparison of four types of target enrichment baits for exome DNA sequencing. Hereditas 158, 10 (2021).
- F Enrhart et.al., A resource to explore the discovery of rare diseases and their causative genes. Scientific Data 8, 124 (2021).
- Machini K et al., Analyzing and Reanalyzing the Genome: Findings from the MedSeq Project. AJHG 105, 177-188 (2019).
- Costain G et al., Periodic reanalysis of whole-genome sequencing data enhances the diagnostic advantage over standard clinical genetic testing. EHSG 26, 740-744 (2018).
Get exclusive rare disease updates
from 3billion.

Sookjin Lee
Expert in integrating cutting-edge genomic healthcare technologies with market needs. With 15+ years of experience, driving impactful changes in global healthcare.