How to Order a Genetic Test for Rare Disease and Improve Diagnostic Yield
Introduction
On the website of a company providing genetic testing for rare diseases, you can easily see “increases diagnostic yield by up to 20% compared to routine WES”1, “Approximately 30% diagnostic yield”2, “Detection rates range from about 28.8% to as high as 57.5% for this patient population”3.
If you search for WES diagnosis yield on PubMed, a medical research database, you will find close to 500 research papers with diagnostic rates ranging from 8% to 70%.
- The average diagnosis rate that the company is talking about, can it be trusted?
- What exactly is the meaning of diagnostic yield? And how is it calculated?
- What kind of diagnosis results are reflected in the ‘diagnostic yield’?
We will take a look at what exactly diagnostic yield means and what factors affect this rate. Lastly, I will suggest some points to consider when choosing a diagnostic company.
How is diagnostic yield calculated?
Diagnostic accuracy and diagnostic yield
It is common knowledge for those who are familiar with diagnostic tests, but those unfamiliar with diagnostic tests confuse the two concepts and ask questions like, ‘How is the diagnostic accuracy high but the diagnostic rate low?’ I will first explain diagnostic yield and diagnostic accuracy, which are indicators used when discussing the effectiveness of diagnostic tests.
All results of genetic testing for rare diseases will fall into the following four categories.
- True Positive (TP): If there is an actual rare disease-causing pathogenic genetic variant and the variant is successfully selected as a result of the test.
- False Positive (FP): When there is no actual rare disease-causing pathogenic variant, but a variant is selected as a result of the test.
- False Negative (FP): If there is a pathogenic variant that causes a rare disease, but the pathogenic variant is not found as a result of the test.
- True Negative (TN): When there is no rare disease-causing pathogenic variant, and the test result shows that there is no pathogenic variant.
It may be easier to understand if you look at the table. Column 1 shows cases where the diagnostic test result is positive or negative, and row 1 shows cases where pathogenic variants that cause the rare disease actually exist or do not.4
| Result | Subjects with the disease | Subjects without the disease |
|---|---|---|
| positive | TP | FP |
| negative | FN | TN |
Diagnostic accuracy
Indices for confirming diagnostic accuracy are typically sensitivity and specificity. Sensitivity is TP / (TP+FN) diagnosing actual positive cases as positive, and Specificity is TN / (FP+TN) diagnosing actual negative cases as negative. In summary, diagnostic accuracy is an indicator that confirms the reliability of a new diagnostic method based on cases in which the ‘correct answer’ has already been verified through the conventional test method.
Diagnostic yield
Diagnostic yield, on the other hand, is the proportion of people who receive a result of having a rare genetic disorder out of all people who have undergone a diagnostic test.
Diagnostic Yield = Positive cases (TP + FP) / Total Cases (TP+FP+FN+TN)
Rare disease diagnosis companies usually perform tests to diagnose undiagnosed cases for the first time based on the latest technology and information in situations where the correct answer is unknown. For this reason, diagnostic yield is said to be as important as diagnostic accuracy.
Why is the diagnostic yield different between analysis results? 4 factors affecting diagnosis rate
1. Diagnostic yield varies greatly by patient groups, such as symptoms, diseases, and age groups.
Symptom and disease groups
According to the results of a neurological disorder diagnosis study, the average diagnosis rate of the NGS diagnostic test is 33.20%, but the diagnosis rate can vary greatly from 10% to 60% depending on the phenotype.5 Diagnostic yield was found to be significantly affected depending on which patient groups the diagnostic company has analyzed. For example, if a diagnostics company undertakes a large national project for a patient population with a relatively high diagnostic rate, the average diagnostic yield will rise accordingly.
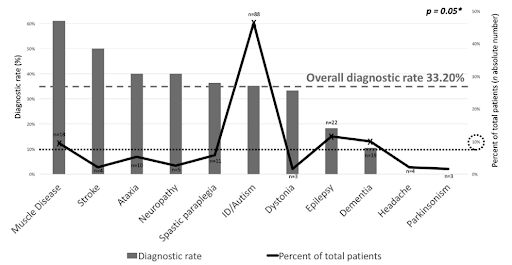
Phenotype spectrum and molecular diagnosis rate of patients undergoing NGS5
Age groups
Even in a group of patients with similar diseases, the diagnosis rate may differ depending on the age. According to a study analyzing 2,008 cases of epilepsy diagnosis, the diagnosis rate differs greatly depending on the seizure onset age6. This means that the average diagnostic yield can increase if a diagnostic company diagnoses a lot of infant patients rather than adult patients in the case of rare epilepsy diagnosis.
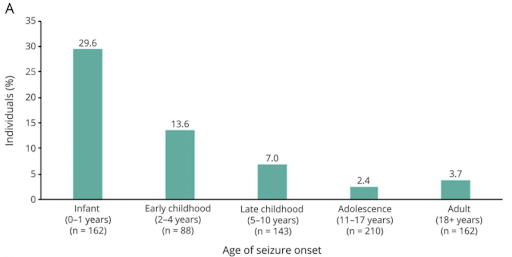
Diagnostic yield by age at seizure onset6
2. Diagnostic yields vary depending on the number of symptoms considered in variant analysis
Even if the same WES test is performed, the number of symptoms that are considered together in the diagnostic test may vary greatly depending on the situation in which the test is performed at a clinical site or a laboratory. As preemptive newborn screening testing expands, a large-scale genomic test is sometimes requested even if there is not enough symptom information that would have an important influence on diagnosis, and in some cases, a test for a patient with various symptoms is requested long after the first symptom appears. In the paper analyzing results of WES testing conducted at the PICU of a Chinese hospital, you can see that the diagnosis rate differs greatly depending on the number of symptoms provided (HPO terms).7
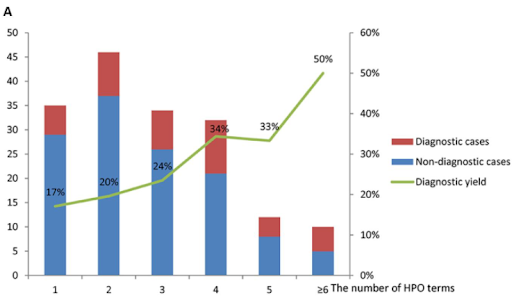
The diagnostic yield of WES in the PICU7
Also, in 3billion’s internal data published in the last article8, you can also see that the diagnostic yield increases when more symptom information is provided from the clinician.
3. Each company has a different level of diagnostic technology.
Even if the same WES-based rare disease genetic test is provided, a complex diagnostic pipeline is involved in the process of producing genomic information and interpreting variants, and there is a difference in the technology for each pipeline. For more detailed information on this, please refer to this article.9
4. There is a lot of room for subjective intervention in the diagnostic process of rare diseases.
Most global companies that diagnose rare diseases are conducting variant analysis according to ACMG guidelines.10 Although there are 28 rules for interpreting variants, the rules (codes) to be applied may vary depending on subjective judgment, so the final result is often different. According to a paper published in 2020, nine laboratories complying with ACMG guidelines analyzed the concordance of the variant interpretation results, and the final concordance rate was 84%.11 In 16% of the variant classification results, there was a disagreement on the final diagnosis even after discussion among laboratories. Diagnosis results may vary depending on the different internal standards of each laboratory.
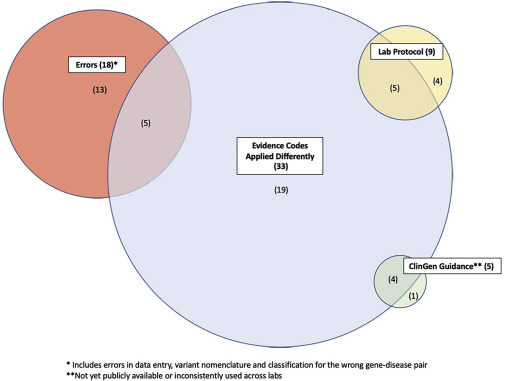
Common reasons for variant classification discordance11
Conclusion
When selecting a laboratory to order a diagnostic test, it is clear that the diagnostic rate is an important indicator of the company’s diagnostic technology. However, as a result of examining the various factors affecting the ‘diagnostic yield’ above, it was found to be difficult to make a judgment by simply comparing the diagnostic yield. So, in addition to the diagnostic rate, what aspects of the diagnostic company should be further considered?
First, is the latest database being used for diagnosis?
It is necessary to check how often the database used for diagnosis is updated and whether the latest information is being reflected in the diagnosis. Information related to rare disease genes accumulates very rapidly12 and all of this information must be reflected for an accurate diagnosis.
Second, does the company provide continuous services until diagnosis?
If there was no disease-causing variant found in the initial analysis, it is necessary to ensure that reanalysis is ongoing and that the company’s medical geneticists are actively communicating with the clinician to diagnose the patient.
Despite advances in technology, more research and collaboration are still needed for the complete diagnosis of rare diseases. For this reason, when choosing a service provider, it is important to check how responsibly they try to solve each case.
There are also ways that clinicians in the medical field can increase the diagnosis rate.
First, the physicians can check whether patients with suspected rare diseases are in the group recommended for first-tier testing of WES or WGS. Numerous studies have shown that there are patient groups where genomic analysis is particularly effective.13
Second, when ordering a test, physicians can deliver accurate and detailed clinical symptoms to the company. In addition, as there may be symptoms that clinicians may miss, a rapid and accurate diagnosis can be made if clinicians actively communicate with the company’s clinical geneticist during the diagnosis process.14
We examined the meaning of diagnostic yield for rare diseases and ways to increase the diagnosis rate together. We look forward to improving the lives of more rare disease patients through collaboration between clinicians and diagnostic companies.
References
- Centogene
- GeneDx
- Quest Diagnostics
- Šimundić AM. Measures of Diagnostic Accuracy: Basic Definitions. EJIFCC. 2009
- Marques Matos C, et al. Diagnostic yield of next-generation sequencing applied to neurological disorders.. Journal of Clinical Neuroscience. 2019
- McKnight D, et al. Multigene Panel Testing in a Large Cohort of Adults With Epilepsy: Diagnostic Yield and Clinically Actionable Genetic Findings. Neurology Genetics. 2022
- Liu Y, et al. Clinical Application of Whole Exome Sequencing for Monogenic Disorders in PICU of China. Frontiers in Genetics. 2021
- 3billion Blog. Why phenotypes matter for genetic testing?
- 3billion Blog. Why do WES test results vary by entity despite the same sequencing method?
- 3billion Blog. What are the ACMG Standards and Guidelines and how do they work?
- Hieter P, et al. Understanding Rare Disease Pathogenesis: A Grand Challenge for Model Organisms. Genetics. 2014
- Laura M.Amendola, et al. Variant Classification Concordance using the ACMG-AMP Variant Interpretation Guidelines across Nine Genomic Implementation Research Studies. AJHG. 2020
- 3billion Blog. In what cases would it be better to conduct WES-based genetic testing for the diagnosis of rare diseases?
- 3billion Blog. Why phenotypes matter for genetic testing?
Get exclusive rare disease updates
from 3billion.

Taeyeon Bae
Marketer & Growth hacker at 3billion. We are using a data-driven approach to improve the lives of people with rare diseases.